In simple terms, Data Analysis is the collection, transformation, and organization of data in order to draw conclusions and drive informed decisions.
GOAL
Companies often possess data that is rich with hidden insights. By asking the right questions and carefully analyzing this data, valuable information can be uncovered. The key is to focus on the questions that lead to meaningful insights and support informed decision-making
RESULT
The results are compiled into a report that includes recommendations and suggested next steps. This report serves as a solid foundation for making informed decisions, reducing costs, and optimizing processes
PROJECT DURATION
Project duration varies between 2 weeks and 3 months. In order to carry out the project as quickly as possible, it is important that the relevant data is available, complete and clean.
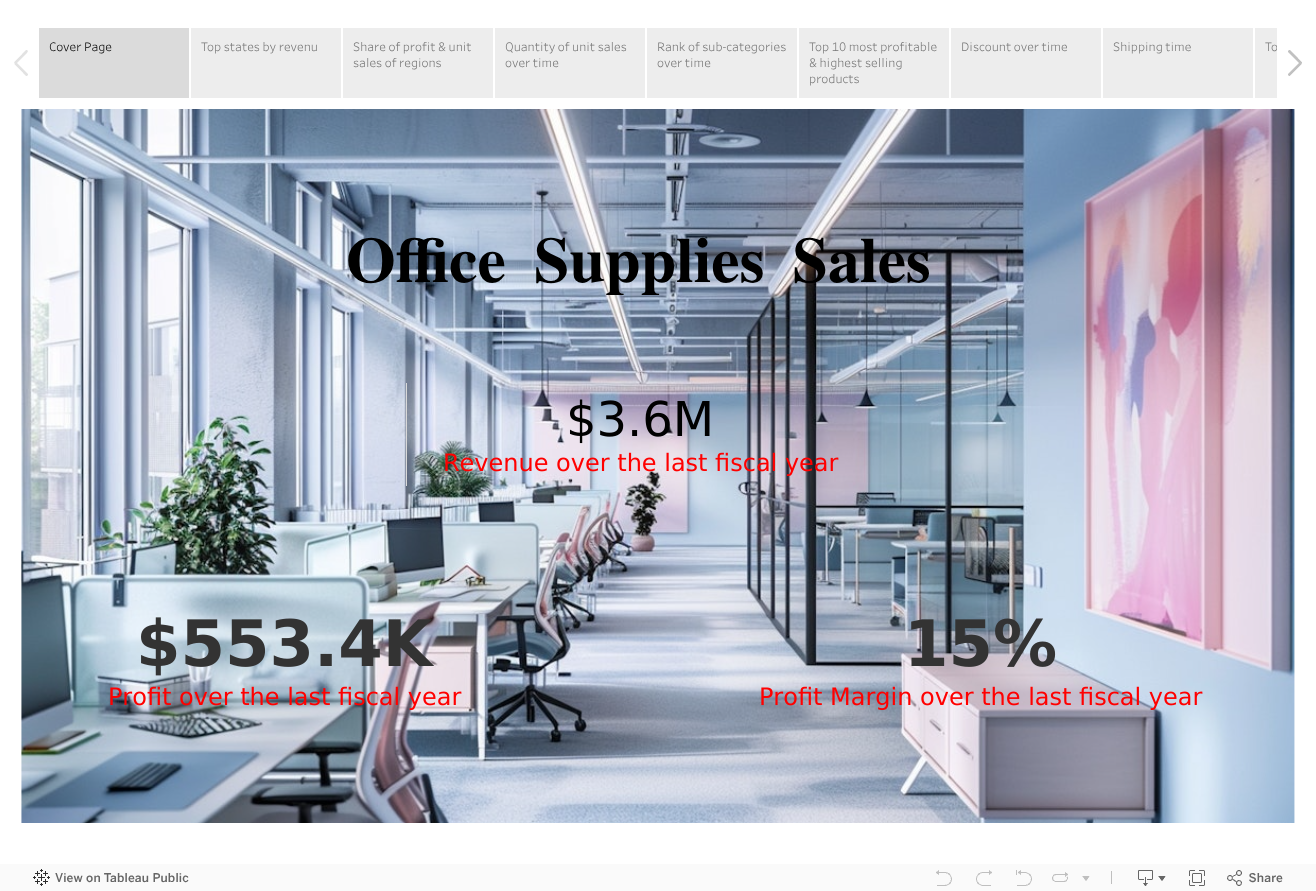
REAL CASE EXAMPLE.
Key questions:
Which are the most valuable segments by revenue?
What are the peak months for sales?
Where the operating costs under target bench mark?
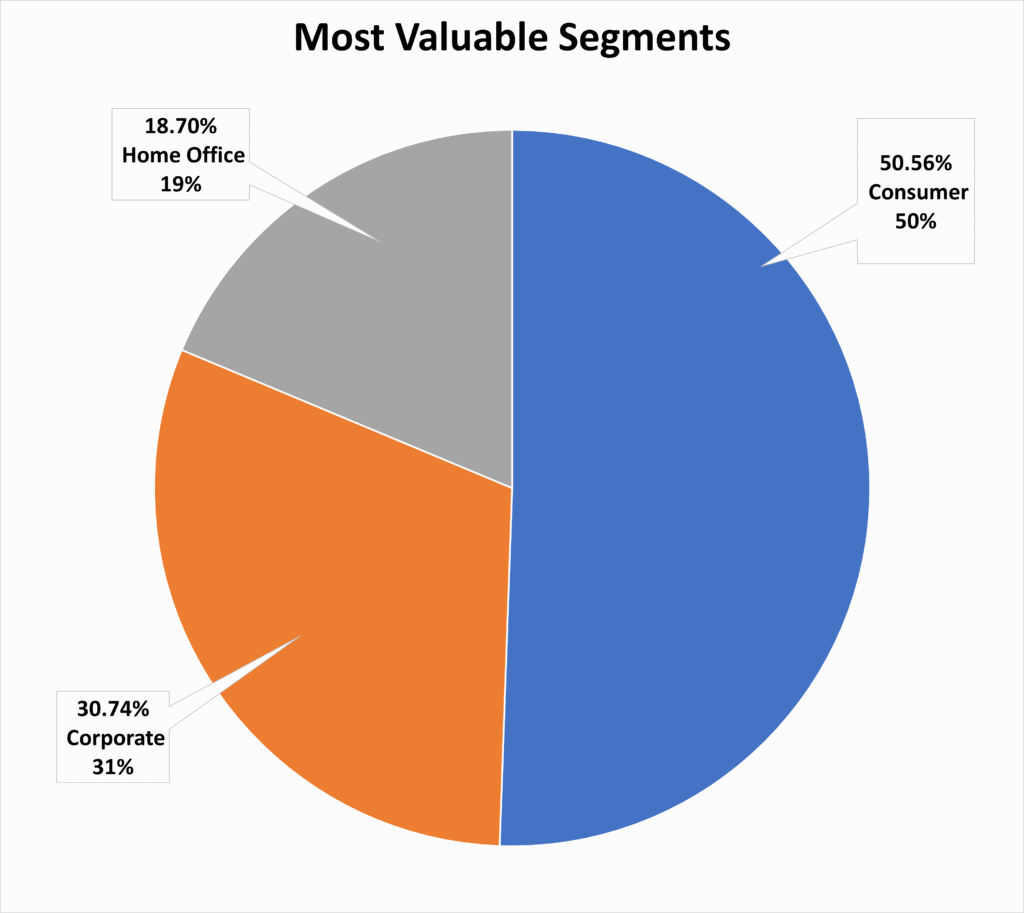
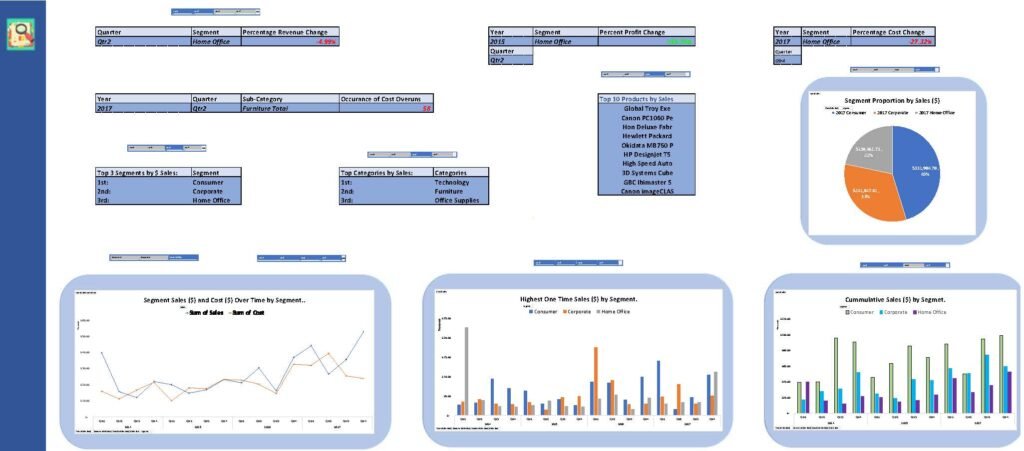
Which are the most valuable segment by revenue?
Look beyond a single most valuable segment and look at the macro composition that makes up each segment. By looking at the categories and sub-categories of products your are able to uncover which categories and sub-categories drive the most value.
Most Valuable Segments
Consumer50%
Home Office29%
Corporate31%
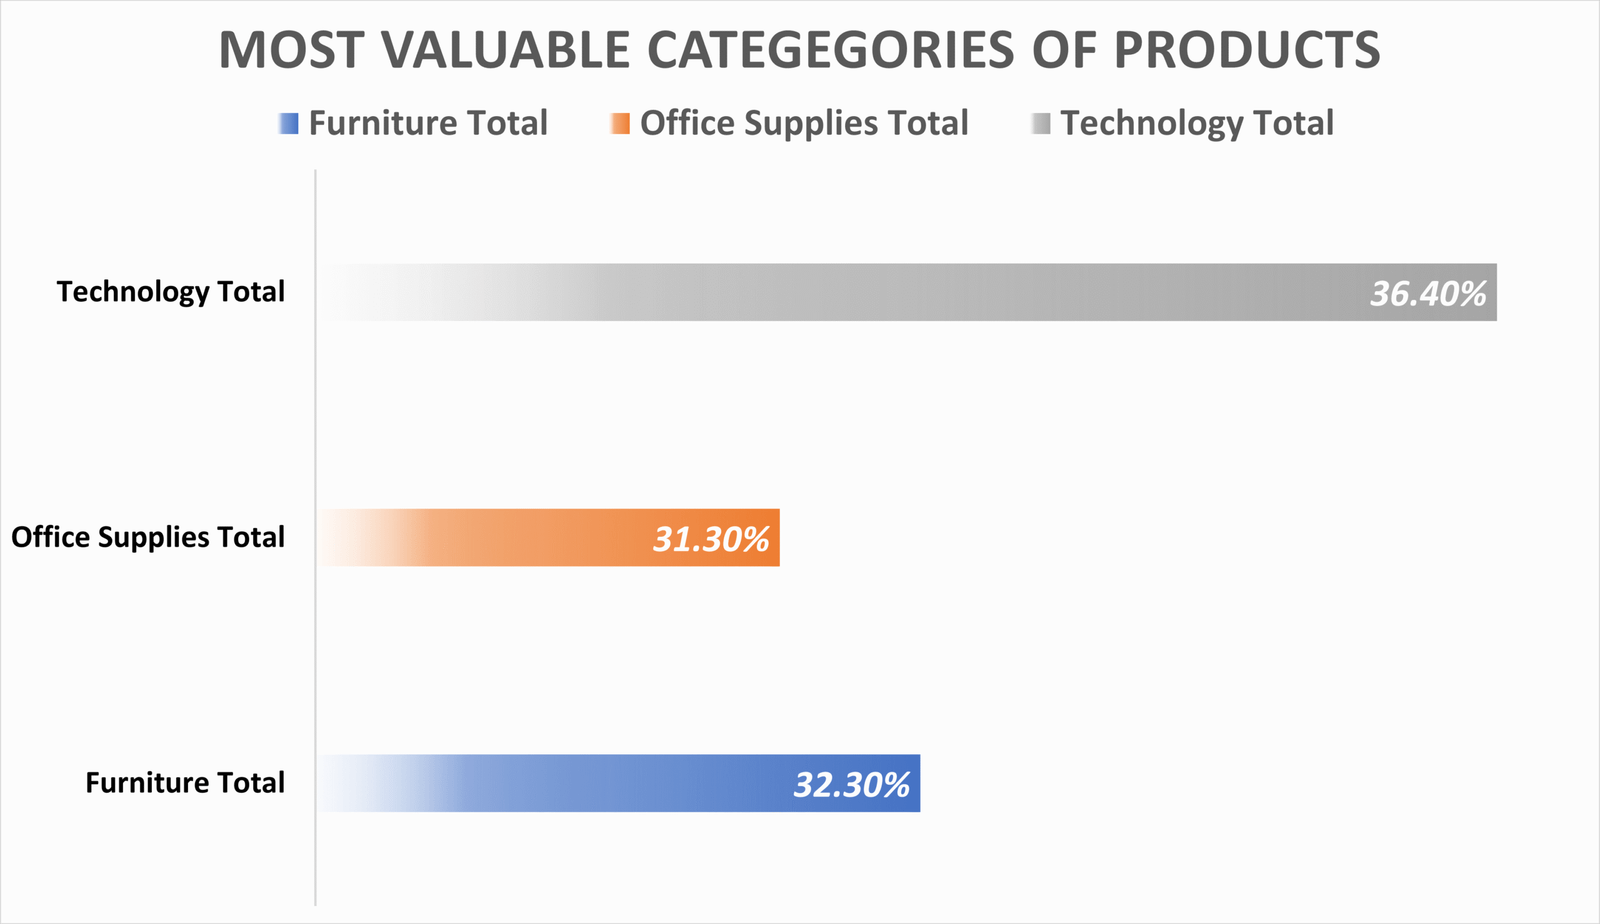
Most Valuable Categories of Products
Technology50%
Furniture32%
Office Supplies31%
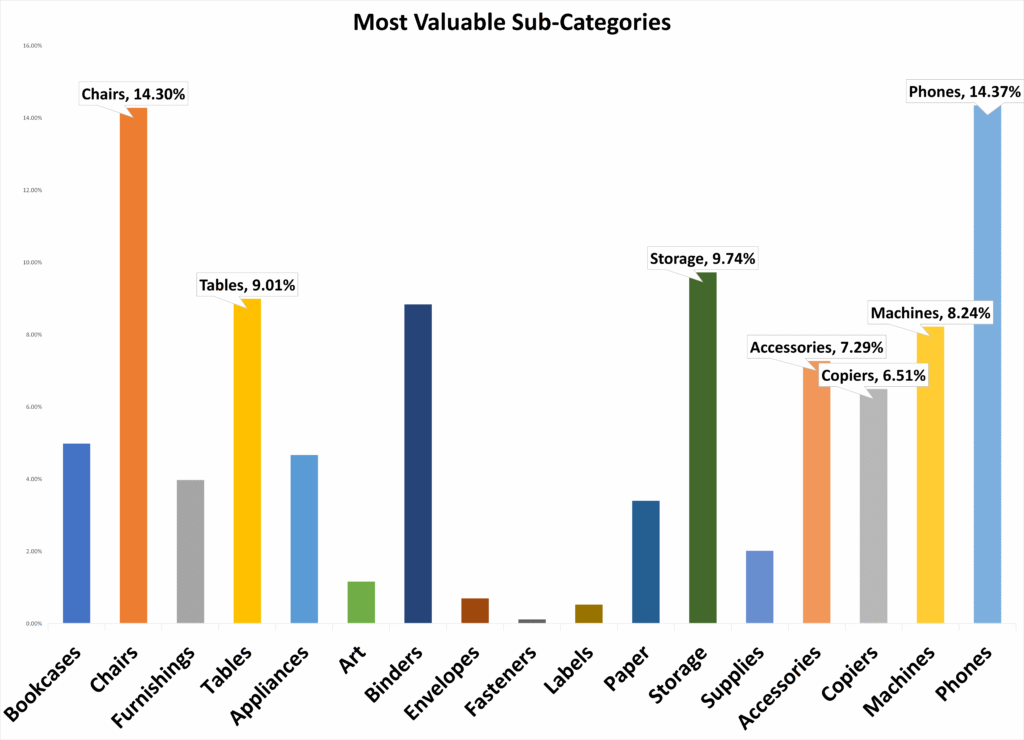
Most Valuable Sub-Categories of Products
Phones39%
Chairs28%
Storage26%
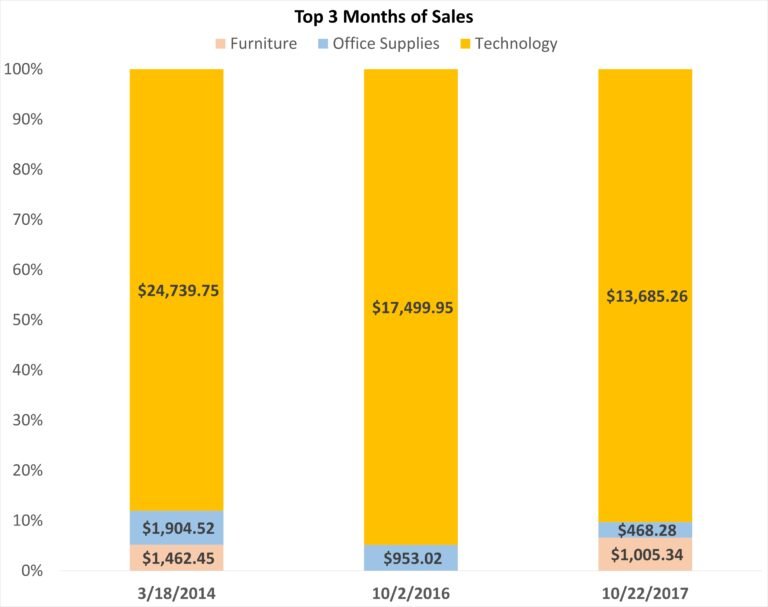
What are the peak months for sales?
Top three sales months over the chosen period with % from product category
3/18/2014
$0
10/2/2016
$0
10/22/2017
$0
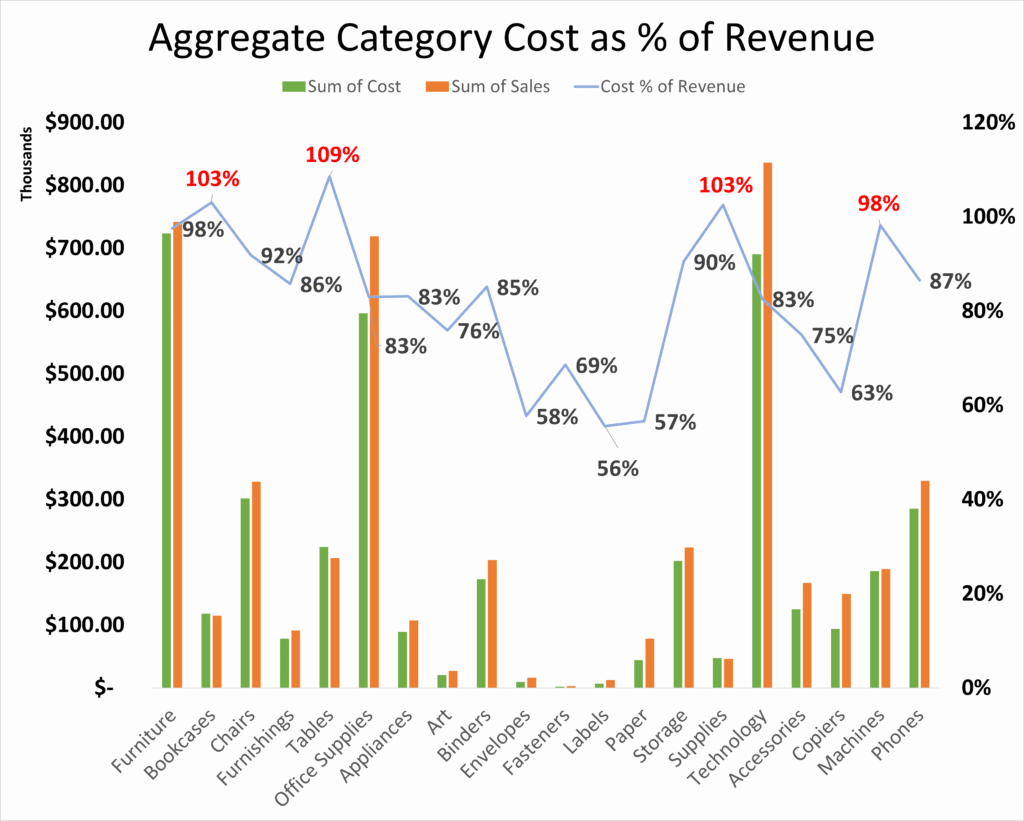
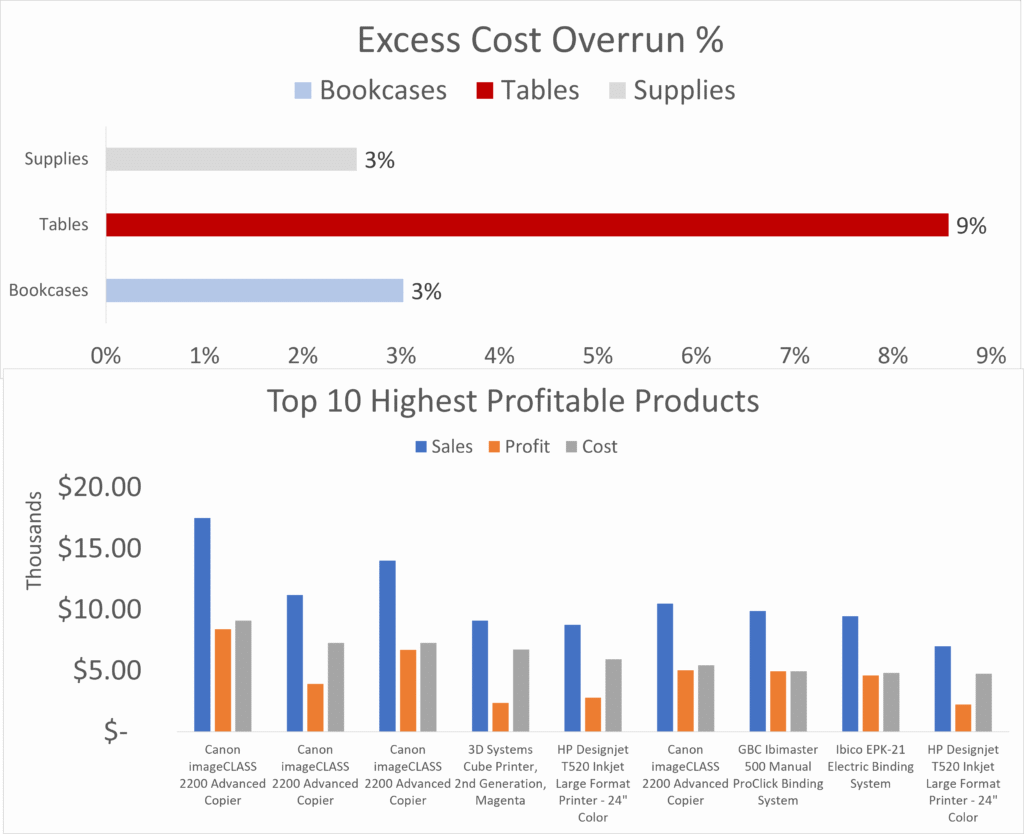
Where the operating costs under target bench mark?
Cost bench to be at 80 % or less of category revenue ( all on aggregate level as chosen by the customer). Further investigation is need to explain cost budget overruns.