What is Data Analytics ?
Data analytics differs from data analysis in that it not only provides insights but also offers guidance on actions to take and forecasts their outcomes. While data analysis helps you understand the current state of affairs, data analytics goes a step further by making predictions and estimating the impact of specific decisions. In essence, data analysis looks at the past and present, whereas data analytics is forward-looking.
The following case illustrates how to data analytics was executed with regression analysis to perform sales forecasting.
There are two dashboards located on this page. Top one is Excel based (non-interactive) & bottom one which is interactive Tableau.
GOAL
- How can we use the analysis to predict future sales?
- How can we minimize marketing costs?
- How can we identify key sales drivers?
- How can we predict demand more accurately without relying on intuition ?
All these kind of questions can be answered by using data analytics techniques.
RESULT
By using mathematical, statistical, and financial modeling techniques I can find patterns & establish a relationship between the data. With powerful software platforms such as Power BI, Tableau, Stata, Excel, Google sheets and more I can make a forecasting model, probability estimation or a statistical model which you can use to make a better business decision.
PROJECT DURATION
Project duration varies between 3 weeks – 2 months. The project starts by getting an understanding of the situation and gathering the appropriate data. After collecting the data, I begin to analyze the data and share the results. Most importantly I will make the model which you can implement in your business.
REAL CASE EXAMPLE -
A coffee shop had a consistent customer volume base with significant amount of data that it wanted to utilize to improve business operations. By leveraging business data and using my expertise in data analytics the business owner is able to forecast future sales by using established relationship with various key sales drivers
By analyzing past sales transactions and quantifying sales & key drivers I am able to help the business owner make informed data-driven decisions. By relying on data-driven decisions instead of intuition, the business will achieve a superior operational planning, trim costs and ultimately improve the bottom line.
How can we identify key sales drivers?
Collaboration with the client and management is essential to understand the business context and form hypotheses about revenue drivers. Based on these discussions, I identify potential independent variables and create visualizations comparing each to revenue. These graphs are then analyzed to assess the impact of each variable on revenue.
How can we use the analysis to predict future sales?
I follow a seven-stage regression analysis process to identify key revenue drivers, build a predictive model, and generate revenue forecasts. First, I define the business objective—typically forecasting daily, weekly, or monthly revenue. Next, I collect relevant data; for this case, in collaboration with the client, we selected marketing spend, foot traffic, customer count, average order value, employee count, and operating hours as potential predictors. I then explore relationships between revenue and these variables through visual analysis and select the appropriate regression model—multiple linear regression in this case. The model is implemented using suitable software (Excel was used here). I evaluate model performance based on explained variance and statistical significance, translating insights into plain language and validating findings with the client to ensure practical relevance. Not all statistically significant variables are used; business context and expert judgment are key. Finally, I generate revenue forecasts using both historical values and adjusted inputs (e.g., interquartile ranges to reduce outlier impact), and present the predictions through clear visualizations.
Summary & Implications
Daily Revenue vs. Number of Customers
- Graph Summary: Strong positive linear relationship.
- Implication: Increasing customer count is the most direct and impactful way to boost revenue. Marketing strategies that increase footfall are high priority.
Daily Revenue vs. Foot Traffic
- Graph Summary: Weak or negative relationship using IQR-filtered data.
- Implication: Foot traffic alone doesn’t guarantee sales; it’s more important to convert walk-ins into paying customers.
Daily Revenue vs. Number of Employees
- Graph Summary: Negative correlation using IQR.
- Implication: Overstaffing reduces profitability. Staffing should match customer volume.
Daily Revenue vs. Marketing Spend
- Graph Summary: Positive but moderate relationship.
- Implication: Marketing works, but ROI may be limited. Campaigns should be performance-tracked to optimize spend.
Daily Revenue vs. Average Order Value
- Graph Summary: Logarithmic positive relationship.
- Implication: Increasing the average order size significantly boosts revenue. Upselling and pricing strategies should be implemented.
Daily Revenue vs. Operating Hours
- Graph Summary: Slight positive logarithmic relationship.
- Implication: More hours may yield more revenue, but with diminishing returns. Open only during profitable hours.
Revenue Per Employee
- Graph Summary: Varies widely, top-performing days reach over $50/employee.
- Implication: Labor efficiency is crucial. Train staff for high productivity, and adjust staffing based on peak hours.
Box Plots of Key Metrics (with IQR filtering)
- Graph Summary: Shows skewed distributions; revenue and marketing spend have high outliers.
- Implication: Outliers can distort analysis. Using IQR gives a clearer picture and better model accuracy.
Forecasted vs. Actual Revenue
- Graph Summary: Forecast model closely tracks actuals.
- Implication: The regression model is reliable and can be used for forward planning and budgeting.
Profit vs. Forecasted Revenue
- Graph Summary: Linear relationship with same slope.
- Implication: Costs are mostly variable. No economies of scale observed; profit grows in tandem with revenue.
Profit vs. Actual Revenue
- Graph Summary: Revenue increases faster than profit.
- Implication: Indicates fixed costs are being amortized, and profit growth accelerates once break-even is crossed — a sign of operational leverage.
Top 10 vs. Bottom 10 Revenue Days
- Summary:
- Top 10 days: High customer count (400–900), high marketing spend, and moderate staffing.
- Bottom 10 days: Low marketing spend, low customer count, inconsistent staffing.
- Implication: Revenue depends more on marketing and customer turnout than extended operating hours or staffing alone.
Overall Implications for Business Strategy
- Customer Growth: Focus on strategies that increase customer count—loyalty programs, promotions, partnerships.
- Optimize Staffing: Match employee shifts to customer volume to avoid overstaffing.
- Boost Order Size: Upselling, product bundling, and pricing adjustments can significantly enhance revenue.
- Use Data-Driven Forecasting: The regression model can reliably predict revenue—use it for planning.
- Control Fixed Costs: Operational leverage is attainable if fixed costs are kept low while scaling sales.
- Selective Operating Hours: Stay open during high-revenue periods only.
Regression Analysis & Excel Dashboard
Excel was used for the technical execution of the project, beginning with data import, cleaning, and formatting to ensure proper organization and usability. Key variables were grouped and filtered using pivot tables, custom sorting, and XLOOKUP. Graphs and plots were created to explore relationships between variables and sales, combining visual insights with statistical analysis. Based on these findings, a multiple regression analysis was conducted using statistically significant variables, refined through client input, to develop a sales forecast equation. Forecasting was limited to specific data ranges for key drivers. Additional deliverables included forecast visualizations, a profit maximization tool, variance analysis, and custom revenue forecasting dashboards—each accompanied by explanatory notes for clarity.
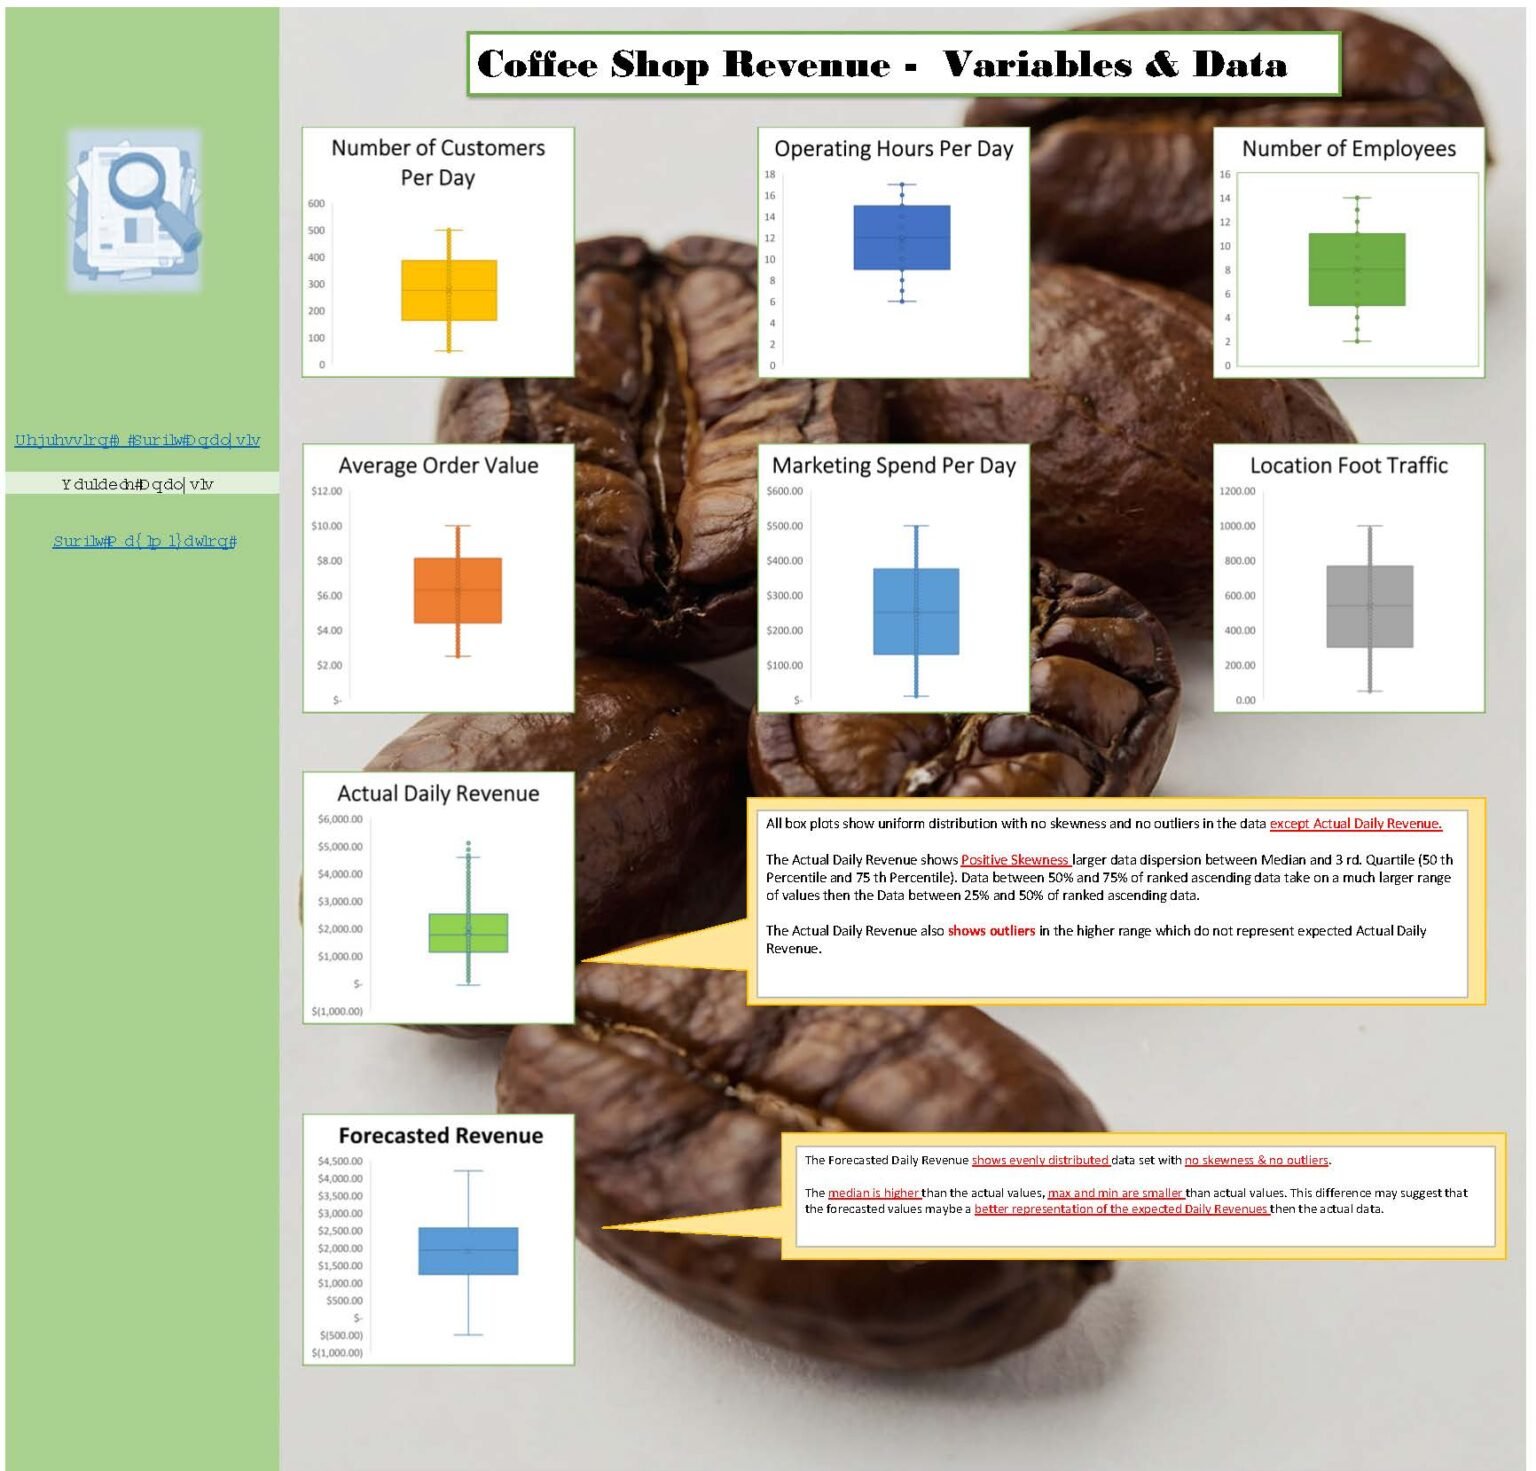
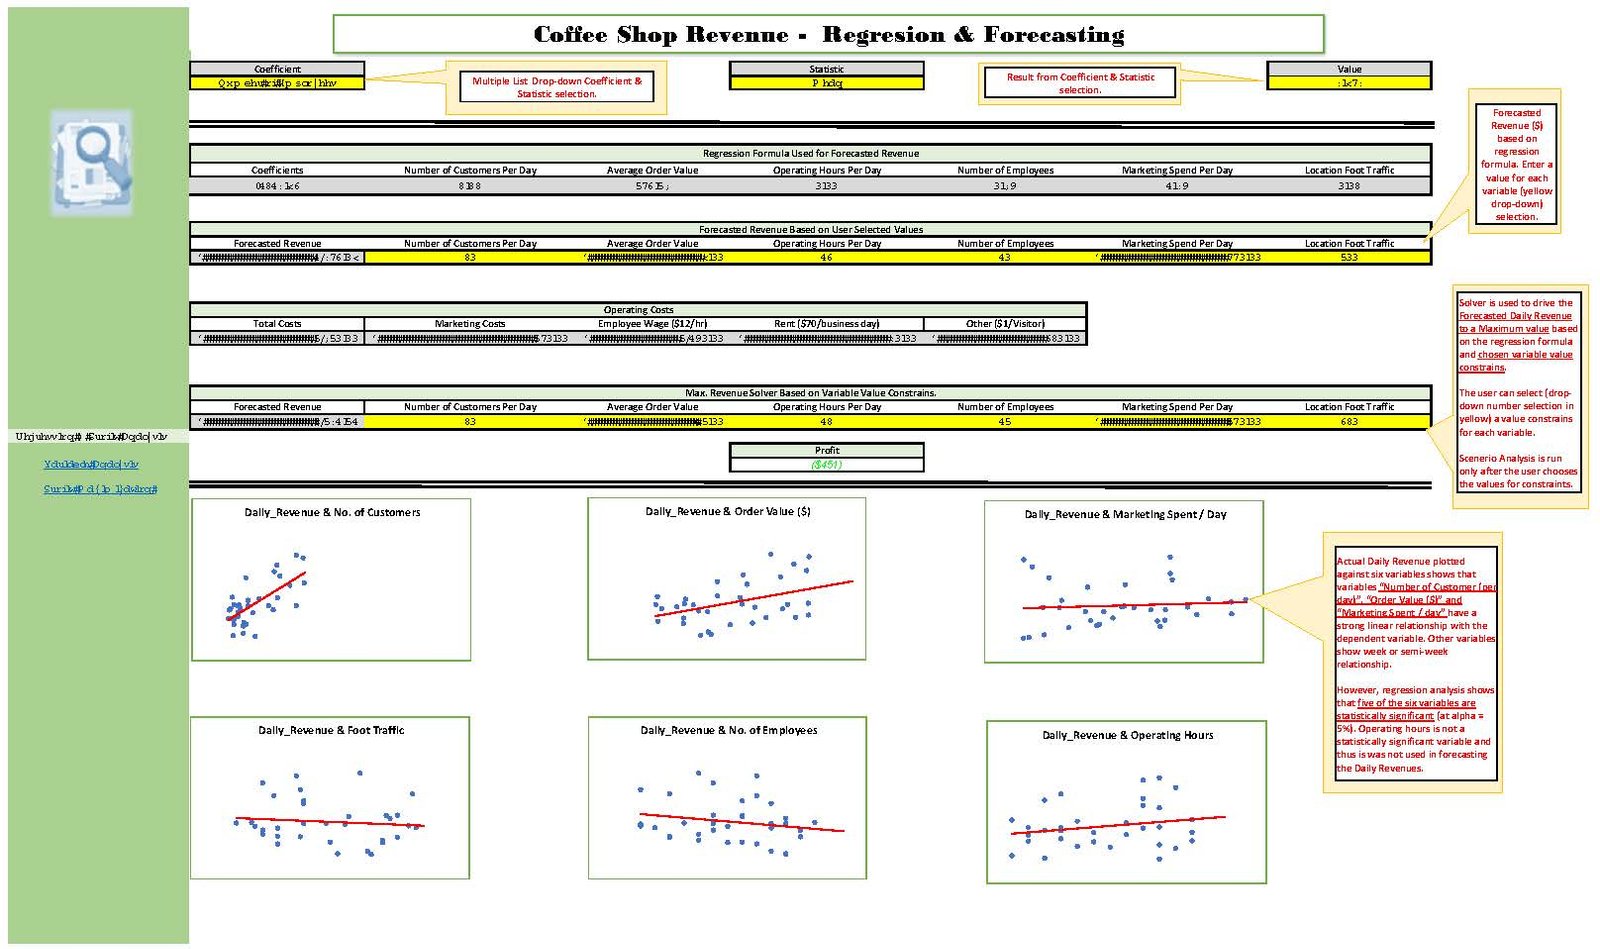
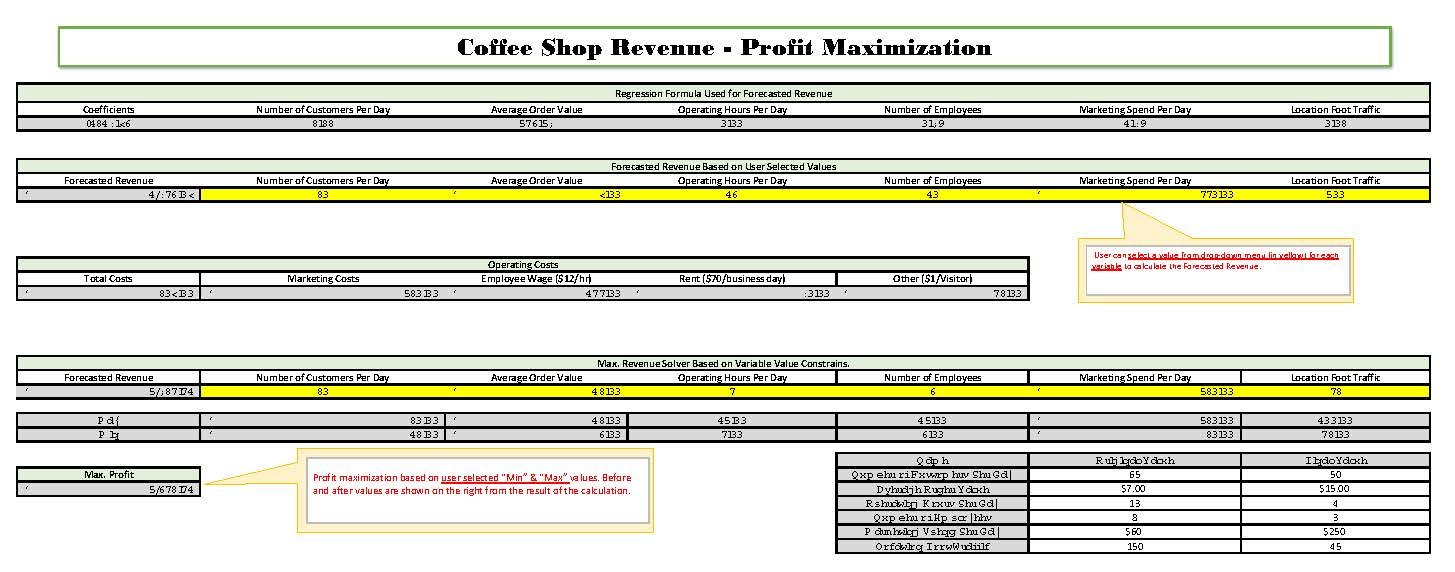
Tableau Interactive Dashboard
Lorem ipsum dolor sit amet, consectetur adipiscing elit. Ut elit tellus, luctus nec ullamcorper mattis, pulvinar dapibus leo.
